Solution
Operational Intelligence & Analytics
Replace manual reporting with real-time dashboards and portfolio analytics. Give management the operational visibility they need to make informed decisions.
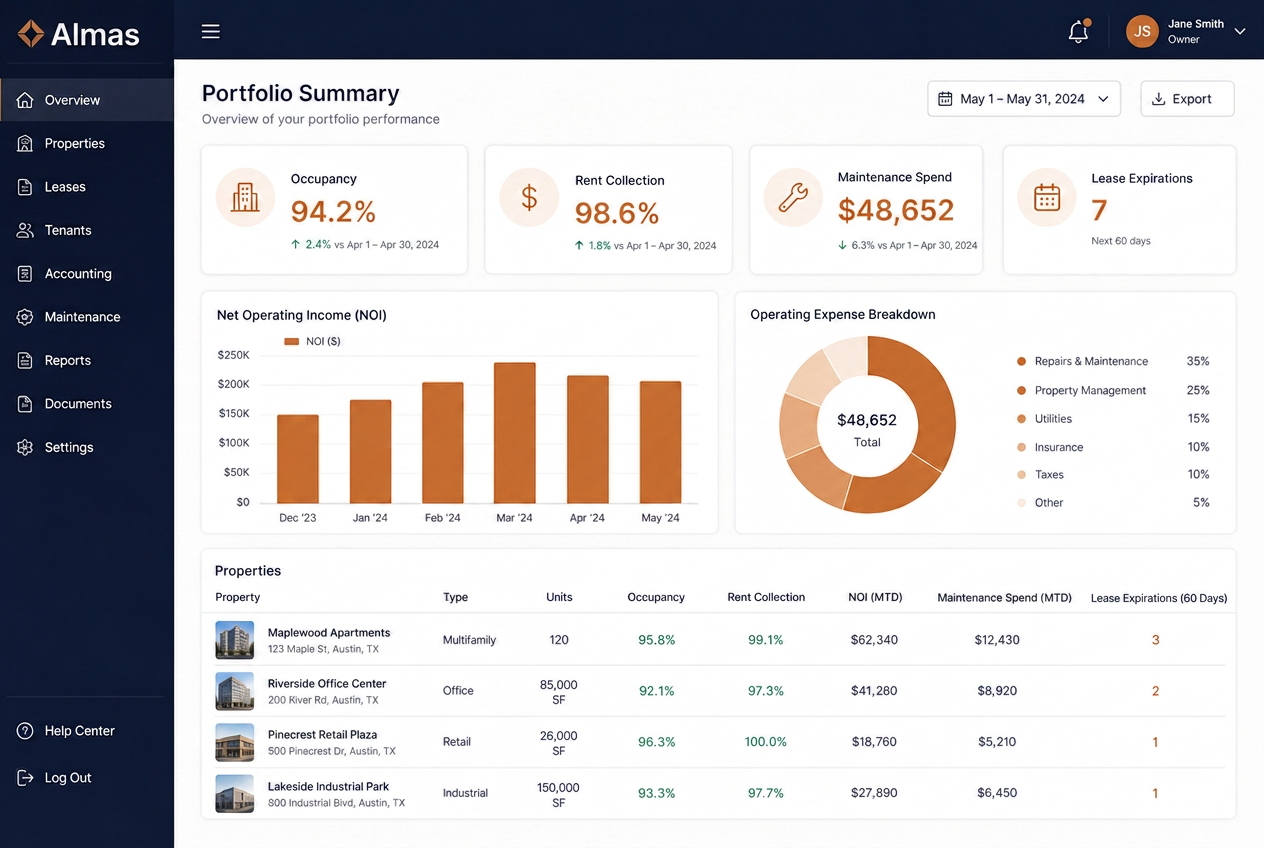
Illustrative interface concept — not a client system
Capabilities
What we automate
Real-time dashboards
Operational data surfaced live, rather than compiled by hand each week.
Portfolio analytics
Trends across properties, contractors, costs and response times in one view.
Executive reporting
Board and client reporting generated automatically from source systems.
Exception alerting
Attention directed to what is off-track, not to what is running normally.
The difference
Before and after
Without automation
- Reports compiled manually every week
- Numbers already out of date when they are read
- Different teams working from different figures
- Problems spotted late, after they have grown
With Almas Software Systems
- Dashboards updated automatically from operational data
- One consistent set of figures across the business
- Client and board reporting produced without manual effort
- Exceptions flagged as they happen
In practice
How this works in a real operation
Weekly management packs were assembled by hand from several systems. Automated dashboards now present the same information continuously, and the reporting effort disappeared entirely.
Our approach
How we'd approach this
A practical, three-step path from where you are today to a working automation.
- 01
Connect operational data sources across your systems
- 02
Design dashboards and reports around the decisions you make
- 03
Add exception alerts so the right people act on the right issues
Questions
Frequently asked questions
Do we need to replace our existing reporting tools?
No. We can aggregate data from your existing systems and push it into a dashboard, or enhance the reports you already produce.
How does data stay consistent across teams?
We define a single source of truth for each metric and automate the data flow, so everyone sees the same current numbers.
How long does reporting automation take to implement?
A focused management dashboard can be live in 4–6 weeks. Full portfolio reporting suites usually take 8–12 weeks.
What does the engagement cost?
We scope the data sources, dashboards and reports and agree a fixed price. The assessment clarifies the cost before any build work.
Explore further
Where this fits
Industry
Property Management
Property management runs on volume: maintenance requests, tenant communication, invoices, inspections and compliance checks.
Learn more about Property ManagementIndustry
Commercial Real Estate
Commercial portfolios carry complex leases, high-value obligations and demanding reporting expectations.
Learn more about Commercial Real EstateBook an operational intelligence briefing
Tell us about your reporting and analytics workflow and we'll show you how automation fits.